I fixed a downtime with a downtime
contents
A production MongoDB started choking. CPU was pinned at 100%, and every application that depended on it was slowing to a crawl.
I ended up fixing it by taking the database offline on purpose. This is the full story: what was happening, why the usual fixes didn't work, the exact steps of the controlled downtime, and what I'd put in place so it doesn't happen again.
What it looked like
The symptoms were the classic ones:
- Database CPU flat at 100% and staying there.
- Every service that talked to that database getting slower, not just one.
- Requests piling up upstream while they waited on the database.
When a whole database is saturated, the first question is never "how do I add capacity", it's "what is using it".
Finding the cause
MongoDB will tell you exactly what it's busy with. currentOp lists the operations running right now:
db.currentOp({
  active: true,
  secs_running: { $gt: 5 }
}).inprog.map(op => ({ opid: op.opid, ns: op.ns, secs: op.secs_running, filter: op.command && op.command.filter, plan: op.planSummary }))
The list was full of the same thing: find() queries on one collection, all long-running, all with a plan summary of COLLSCAN.
A collection scan means MongoDB has no index it can use for that query, so it reads every document in the collection to find the matches. On a small collection you don't notice. On a large one, each query becomes expensive, and when an application sends a steady stream of them, they eat all the CPU there is.
You can confirm it for a single query with explain:
db.<collection>.find({ <field>: <value> }).explain("executionStats")
// winningPlan.stage: "COLLSCAN"
// totalDocsExamined: the whole collection, for a handful of results
So the cause was clear: one query pattern, on one collection, with no index. One application's traffic was enough to take the database's compute away from everyone else.
The usual fixes, and why they failed
I tried the standard moves first.
| What I tried | What happened |
|---|---|
Killed the query with killOp | It came back |
| Purged all the running ops on that collection | They came back |
| Scaled up the compute | The scans used up the new capacity too |
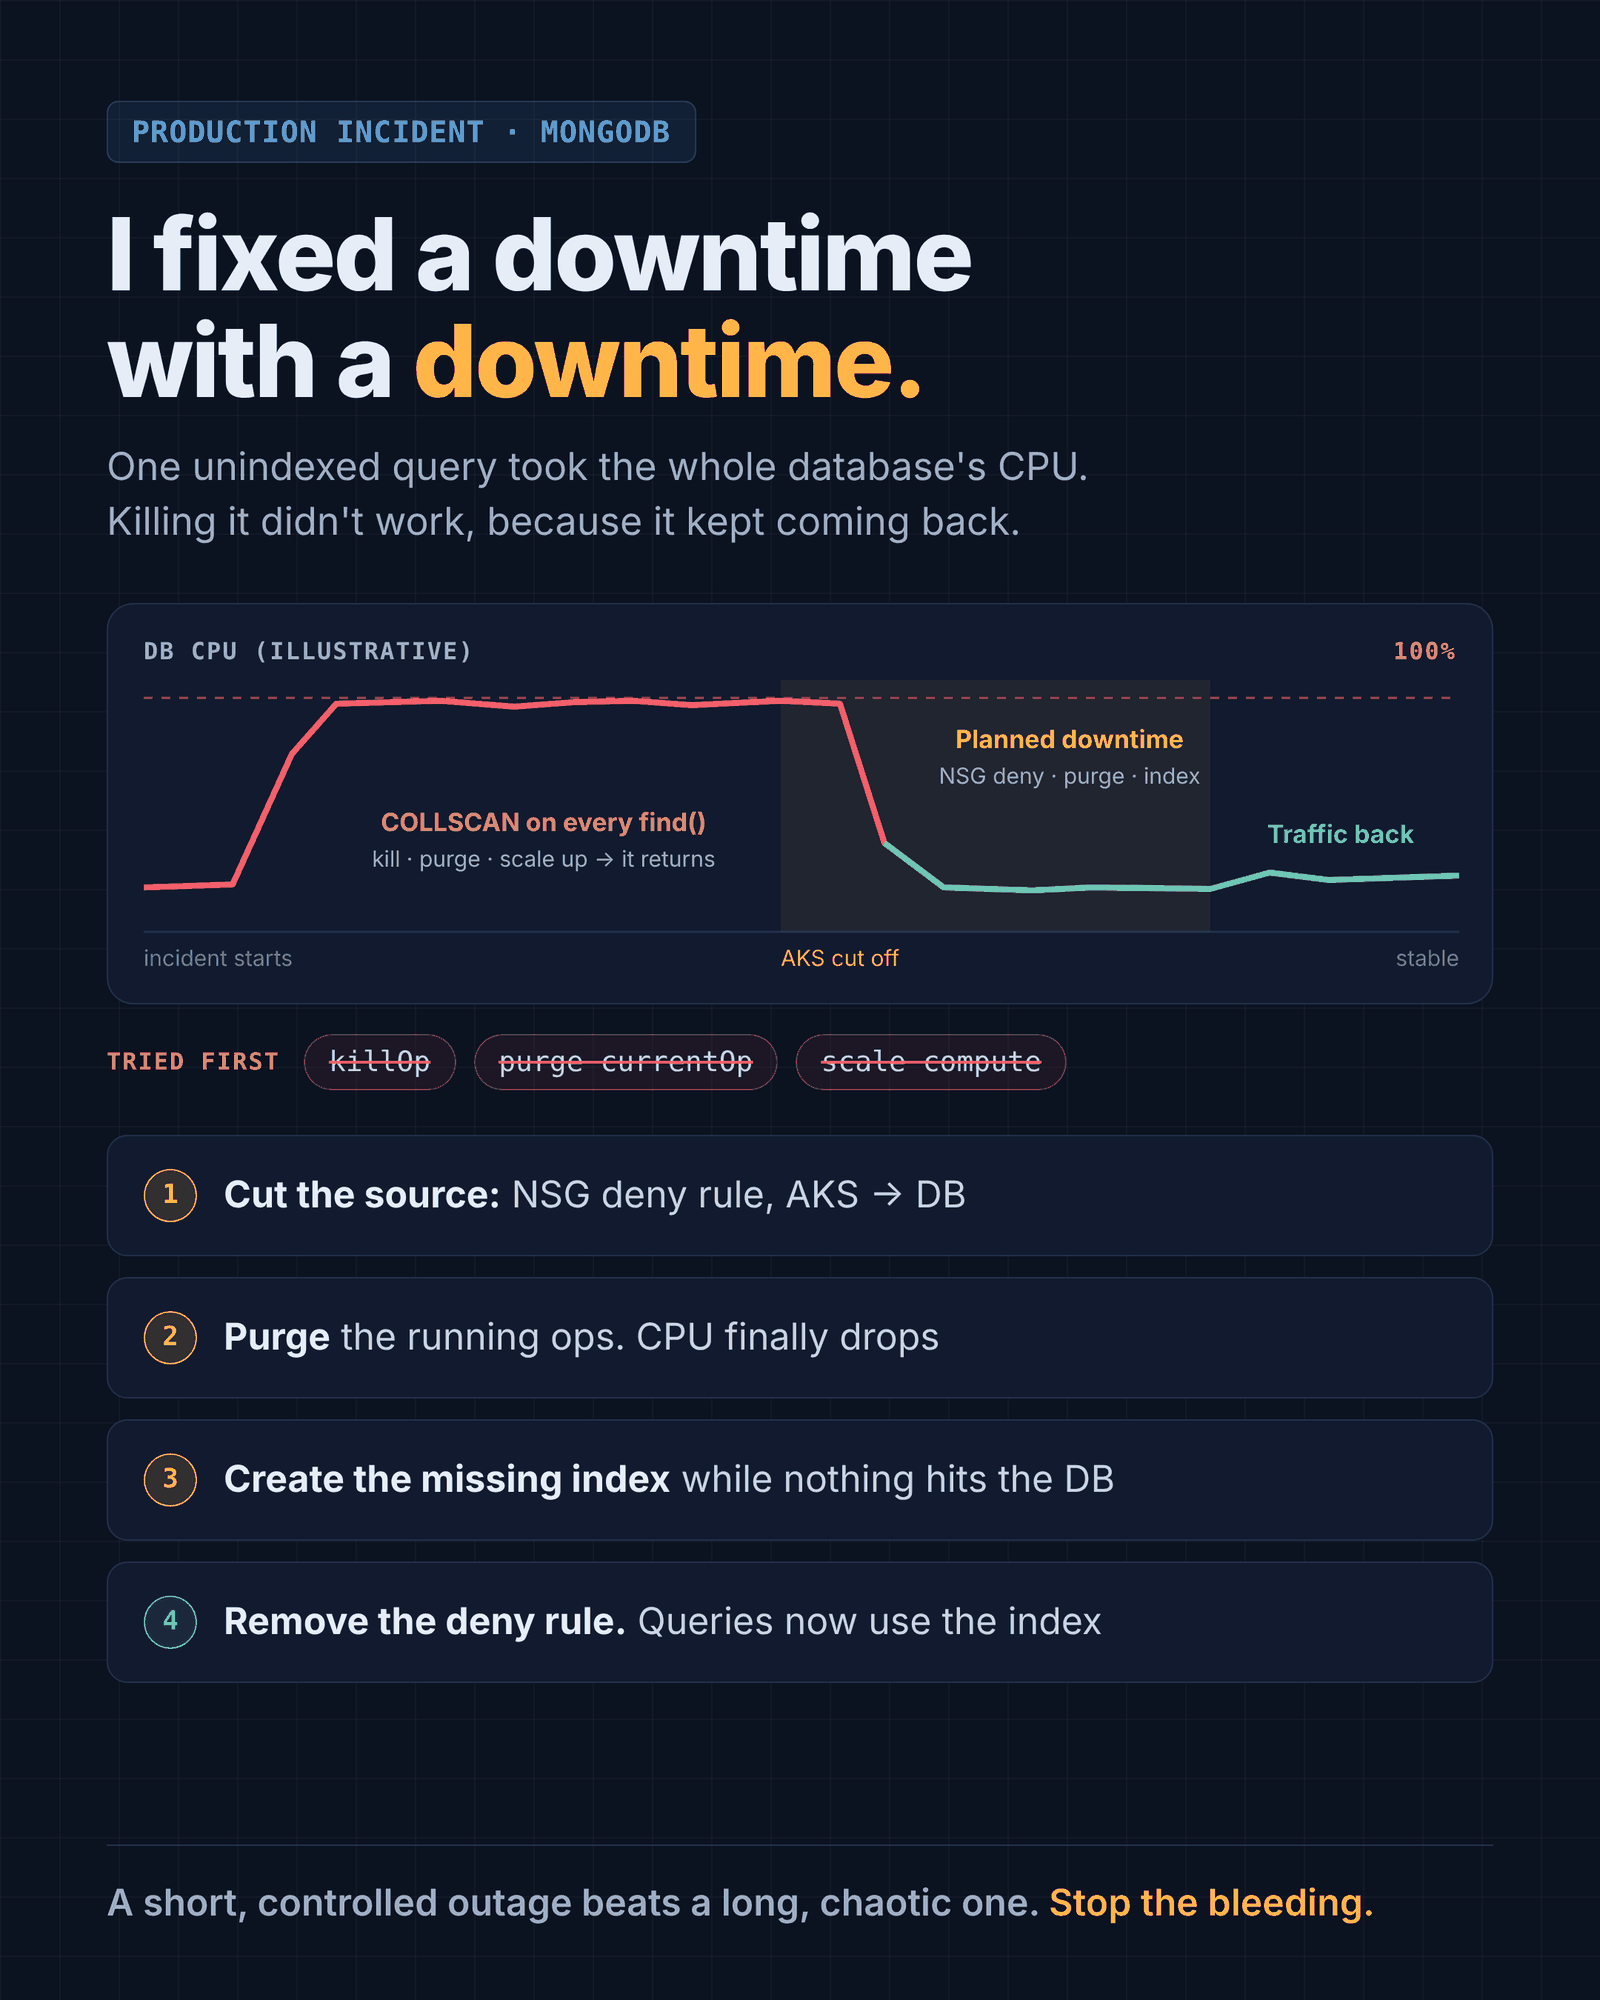
All three failed for the same reason: the source was still open. The application kept firing the same query. As fast as I killed them, new ones replaced them.
Scaling up didn't help either. More CPU makes each scan slightly faster, but an inefficient query doesn't get efficient with more hardware. The extra headroom just let more scans run at once.
I was fighting the symptom while the cause kept feeding it.
The decision: a short downtime to end a long one
At that point every dependent service was already degraded, and there was no sign it would recover on its own. The options were:
- keep killing queries and hope, while everything stays slow, or
- take a short, deliberate outage for that database, fix the actual problem, and bring it back.
The fix itself was simple: create the missing index. The problem was doing it on a database that was at 100% CPU and being hammered by the very query the index was for. So I needed the database to be quiet first.
The fix, step by step
1. Cut the source at the network
The traffic came from the AKS cluster. I added an inbound Deny rule on the database's NSG for traffic from the AKS address range, with a higher priority (lower number) than the rule that normally allows it:
az network nsg rule create -g <rg> --nsg-name <db-nsg> -n deny-aks-to-db-temp \
  --priority 100 --direction Inbound --access Deny --protocol Tcp \
  --source-address-prefixes <aks-address-range> \
  --destination-port-ranges 27017
Blocking at the network instead of in the application had real advantages in the middle of an incident: one change, one place, no redeploys, no hunting down every service and replica, and it's trivial to undo.
2. Purge what was already running
Blocking new traffic doesn't stop the scans that are already executing. NSG rules are applied to new flows, and existing connections can keep going after a rule change, so the purge still mattered. With nothing new arriving, killing the in-flight operations finally stuck:
db.currentOp({ active: true, ns: "<db>.<collection>", planSummary: "COLLSCAN" })
  .inprog.forEach(op => db.killOp(op.opid))
This time nothing replaced them, and the CPU finally dropped.
3. Create the missing index on a calm database
With the database idle, I created the index the query needed:
db.<collection>.createIndex({ <field>: 1 })Building an index on a large collection takes real CPU and I/O. Doing it on a quiet database means it finishes faster and doesn't compete with production traffic.
Before letting traffic back, it's worth confirming the query will actually use the new index:
db.<collection>.find({ <field>: <value> }).explain("executionStats")
// winningPlan: IXSCAN on the new index
// totalDocsExamined: roughly the number of results, not the whole collection
4. Remove the Deny rule and let traffic back
az network nsg rule delete -g <rg> --nsg-name <db-nsg> -n deny-aks-to-db-tempTraffic came back, the same queries hit the database, and this time they used the index. The database went back to normal and has stayed stable since.
Why this worked
The order mattered:
- Stop the inflow so the problem can't regenerate.
- Clear the backlog so the system can recover.
- Fix the root cause while nothing is competing with it.
- Restore traffic and confirm the fix holds under real load.
Steps 2 and 3 are what I'd tried first, and they failed because step 1 was missing.
What I'd put in place so it doesn't happen again
- Catch collection scans before production does. Run
explain()on new query patterns in code review, and watch the slow-query log or profiler forCOLLSCANon large collections. - Alert on the cause, not just the symptom. A sustained CPU alert is good. An alert on slow queries or scanned-to-returned document ratios tells you why.
- Keep indexes in code. Define them alongside the application or in migrations so a new query and its index ship together.
- Put a ceiling on queries.
maxTimeMSon application queries stops a single bad query from running forever. - Have the circuit breaker ready. Know which NSG and which address range you'd block before the incident, and write it down in a runbook.
Takeaways
- Killing a query doesn't help if the source keeps sending it. Cut off the source first.
- Scaling won't fix an inefficient query. It just gives the scan more room to grow.
- Network controls are incident-response tools too. An NSG rule worked as a circuit breaker.
- Sometimes the best fix is a deliberate pause. A few minutes of planned downtime beat hours of uncontrolled degradation.
- Check your indexes before production does it for you.
A short, controlled outage beats a long, chaotic one. Stop the bleeding first.
Have you ever had to break something on purpose to save it? Tell me on LinkedIn.